Separate stock count variance from usage variance
Imagine an evening count finds 8 kilograms of an ingredient while the system shows 10. If count variance means counted quantity minus system quantity, the difference is −2 kilograms. That identifies a mismatch, not its cause. An unrecorded withdrawal, an incorrect receipt or a counting error could produce the same result.
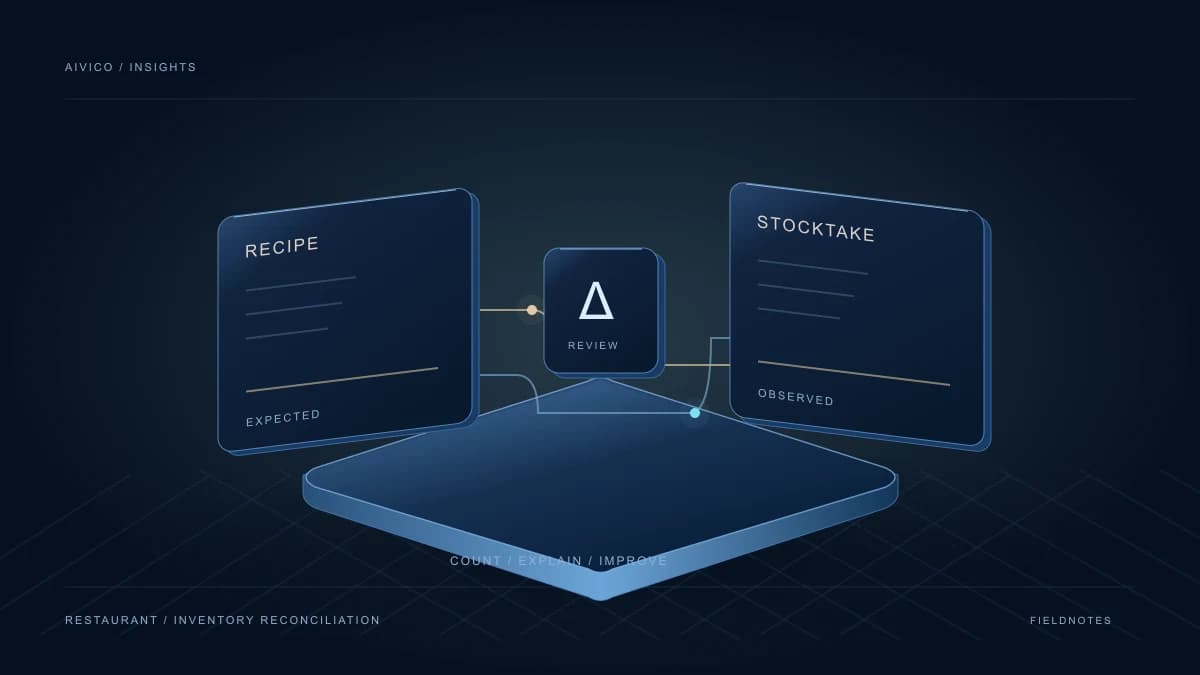
Theoretical usage means the ingredient quantity expected from the recipes of prepared items. Here, we calculate sales-related theoretical usage separately, then account for other withdrawals such as staff meals and recorded waste. The goal is to explain the movements behind the difference, rather than simply overwrite the system balance. Usage variance and stock count variance can have opposite signs, so name the convention used in your report.
Align the period, location and measurement unit
If the stocktake happens at Monday’s close, include sales, receipts and transfers up to the same cutoff. Track any movements that occur while counting. A shift running past midnight and an inventory report based on calendar dates may not cover the same period.
Measurements also need a common basis. You might buy by the case, store by the kilogram and write recipes in grams, but the conversions must be explicit. Container weight, changing pack sizes and treating raw and cooked ingredients as equivalent all distort the comparison. If a recipe uses prepared net weight, account for preparation yield. Do not add a preparation loss as separate waste when the recipe allowance already includes it.
Worked example: how much of 28 kilograms can you explain?
Consider one ingredient in one storage location. All figures below use the same raw-ingredient kilogram basis. Assume there are no returns or other movements, the recipe stays unchanged during the period, and the closing count has been checked.
Count-derived usage equals opening stock plus receipts plus inbound transfers, minus outbound transfers and closing stock. This includes quantities leaving stock for reasons other than sold meals. In an actual operation, include additional movements such as supplier returns with the appropriate direction.
| Item | Calculation | Quantity |
|---|---|---|
| Opening stock | Count at period start | 20 kg |
| Receipts | Quantity delivered into stock | +15 kg |
| Inbound / outbound transfers | 2 kg in − 1 kg out | +1 kg |
| Closing stock | Count at period end | −8 kg |
| Count-derived usage | 20 + 15 + 2 − 1 − 8 | 28 kg |
| Sales-related theoretical usage | 120 portions × 0.18 kg | 21.6 kg |
| Recorded staff meals | 10 portions × 0.18 kg | 1.8 kg |
| Recorded waste | Not already included in recipe loss | 2 kg |
| Explained usage | 21.6 + 1.8 + 2 | 25.4 kg |
| Unexplained variance | 28 − 25.4 | 2.6 kg |
Comparing directly with sales usage gives a 6.4-kilogram difference. Accounting for staff meals and recorded waste leaves 2.6 kilograms to investigate. That remainder is not automatically waste or misconduct. Check missing records, recipe accuracy, portion variation and count accuracy before assigning a cause.
Check the recording points in a repeatable order
Start by recounting the ingredient across all relevant storage areas. Then inspect receipt and transfer records. A movement between two stores is an input or output when reviewing one store, but should cancel out when reviewing both together. Recording it as both a transfer and consumption distorts the result.
Next, reconcile sales with recipes. Extra ingredients, portion options, recipe changes and cancelled orders need particular attention. An order cancelled before preparation has a different stock consequence from a prepared meal that cannot be served. Make the event that creates an inventory movement explicit; order, payment and kitchen records must not create the same consumption more than once.
- Receipts: was the ordered quantity recorded, or the quantity actually delivered?
- Recipes: are the quantities and options correct for the date being reviewed?
- Non-sales consumption: were complimentary items, staff meals and trial batches recorded?
- Waste: can you distinguish spoilage, preparation loss and service waste?
- Counts: did you include open packs, prep areas and cold storage?
Make waste recording practical during a shift
The EPA’s food waste assessment resources provide tools for tracking the amount, type and source of wasted food. In a restaurant, that means recording which ingredient was lost, how much and at which stage, rather than simply marking an event as ‘waste’. Preparation loss and spoiled stock can then be reviewed separately.
Keep the entry process short enough to use during service. Ingredient, quantity, unit, reason, time and location are a useful starting scope. Define common reasons and allow an explanation where needed. Review recurring patterns instead of assigning every difference to ‘other’. Use the record to improve production and planning decisions, rather than to assume that a particular person is responsible.
Track the explanation alongside the weekly number
Start with a few operationally important ingredients rather than investigating every item at the same intensity. Use consistent counting methods and reporting intervals. For each ingredient, record the unexplained quantity, possible cause, assigned action and next review date. Do not ignore negative variance: understated recipe usage, missing receipts and overcounting can create differences in different directions.
If you report a percentage, state the denominator. In this example, unexplained variance divided by count-derived usage is 2.6 / 28, or about 9.3%. That is not a food waste rate or a universal acceptable threshold. Sales volume, production methods and measurement accuracy affect the comparison, so a single percentage should not become the only measure of success.
What should you expect from the software?
A useful report should make the records behind a difference easy to inspect. Moving from a stock movement to the relevant receipt, recipe or operational record turns a general concern into a specific investigation. Keeping the previous value and reason for an adjustment also helps the team understand whether the same problem returns at the next count.
Ordwell’s recipe, cost and stock management areas provide a starting point for discussing these relationships within restaurant operations. During a product evaluation, choose one of your own ingredients and walk through receipts, sales, staff consumption and counting in a demo. Confirm the event that triggers stock deduction and how your existing records will map to the workflow; a feature name alone does not explain its behaviour.
A short plan for your next stocktake
The first goal is to explain the difference, not to display zero variance. Establish a reliable comparison for a few ingredients, then expand the scope. That gives the team a stronger basis for decisions than reporting the entire menu with incomplete records.
- Define the location, counting cutoff and comparison period.
- Check units, recipe quantities and preparation yield.
- Complete receipts, transfers, complimentary items, staff meals and waste records.
- Calculate count-derived usage and compare it with explained consumption.
- Assign one concrete action for the remaining variance and review it in the next period.